Techniques: Mesh Modeling
Some of the benefits of voxel-based visualization have been mentioned previously, e.g. having a comprehensive view on the patient's anatomy, being able to spot all the little details, assuming of course that the resolution is high enough in all dimensions, etc.
As soon as the volumetric display has fulfilled its purpose, it is time to create something more tangible. The advantages of polygonal meshes are numerous. Having a discrete set of objects with well-defined surfaces will provide opportunities like:
calculating several metrics of each surface comprised of vertices, edges and faces using the tools available for mesh modeling,
selecting individual points on a surface of an object that correspond to anatomical features,
create geometric shapes utilizing these points, like lines, polylines, planes, half-planes, etc.,
measuring distance and angular relationship between these objects,
if done right, creating individual closed shells that correspond to certain regions based on connectivity of the polygons,
and many more. This particular post does not cover the different methods to create 3-D polygonal (mostly triangular for rendering reasons) mesh models from medical DICOM data. One could use available commercial or open-source software solutions, for the latter I would recommend something like InVesalius or Seg3D to create these models, then use Autodesk Meshmixer or MeshLab to perform operations on the meshes.
Keep in mind, that using pre-existing software tools do not guarantee compatibility in every aspect. For example, meshes exported in STL or OBJ - or any other format for that matter - originating from the same source data, but processed with different tools could very well lead to the objects having different orientation in relation to each other when imported elsewhere. Needless to say, orientation is especially critical in medical image data. Also, be aware that several of the existing tools have a rather shallow learning curve, partially due to the sheer amount of functionality and their not so user friendly interfaces. (One could spend months, if not an entire year trying to classify the type of operations possible in each, how they are performed, how they relate to each other, and all the nuances in between.)
In my opinion a better approach would be to use established platforms like MITK, or even better: start from scratch, if possible! A lot can be learned from implementing one of the classic marching cubes variations (sources on the original versions could be found on the wiki page and also here). There are a ton of sample code snippets out there, with many different cube configurations and edge indexing versions, but as guidance, personally I would recommend using the code provided by László Szirmay-Kalos in his computer graphics books as a template. In case any of these is too meticulous, the class vtkMarchingCubes in the Visualization Toolkit produces almost identical results to the original in my experience, with a likely small difference in the marching direction of the cube itself.
Quick case summary
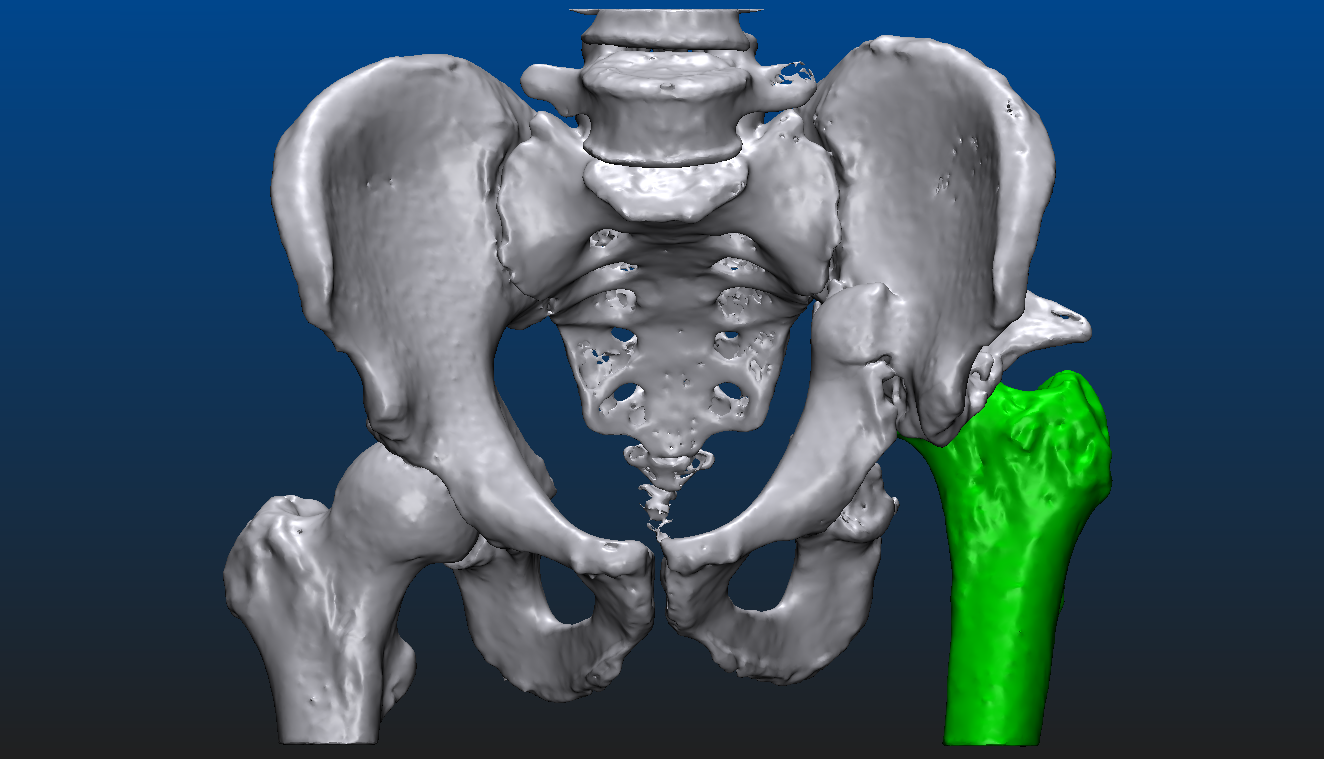
Let us take a look at what is actually possible with mesh models through an example. The patient suffered an accident that shifted the proximal head of the left femur out of the socket, destroying half of the acetabular surface and most of the bone mass responsible for securing the socket. From the CT image data a triangular mesh model can be created with a well chosen threshold, representing all the bone structure in the volume. By choosing a higher threshold and/or performing some careful manual corrections - potentially using an end-to-end 2D-3D segmentation process which we won’t dive into here - the proximal end of the left femur can be segmented as a separate entity. Both are shown below, close to an anteroposterior (AP) view. In the second image, everything other than the left femur is set semi-transparent for a better understanding of the relative dislocation compared to the right side of the hip. (All the underlying, messy inner structure can be seen in the transparent version, hinting that marching cubes was indeed used to create the mesh surfaces.)
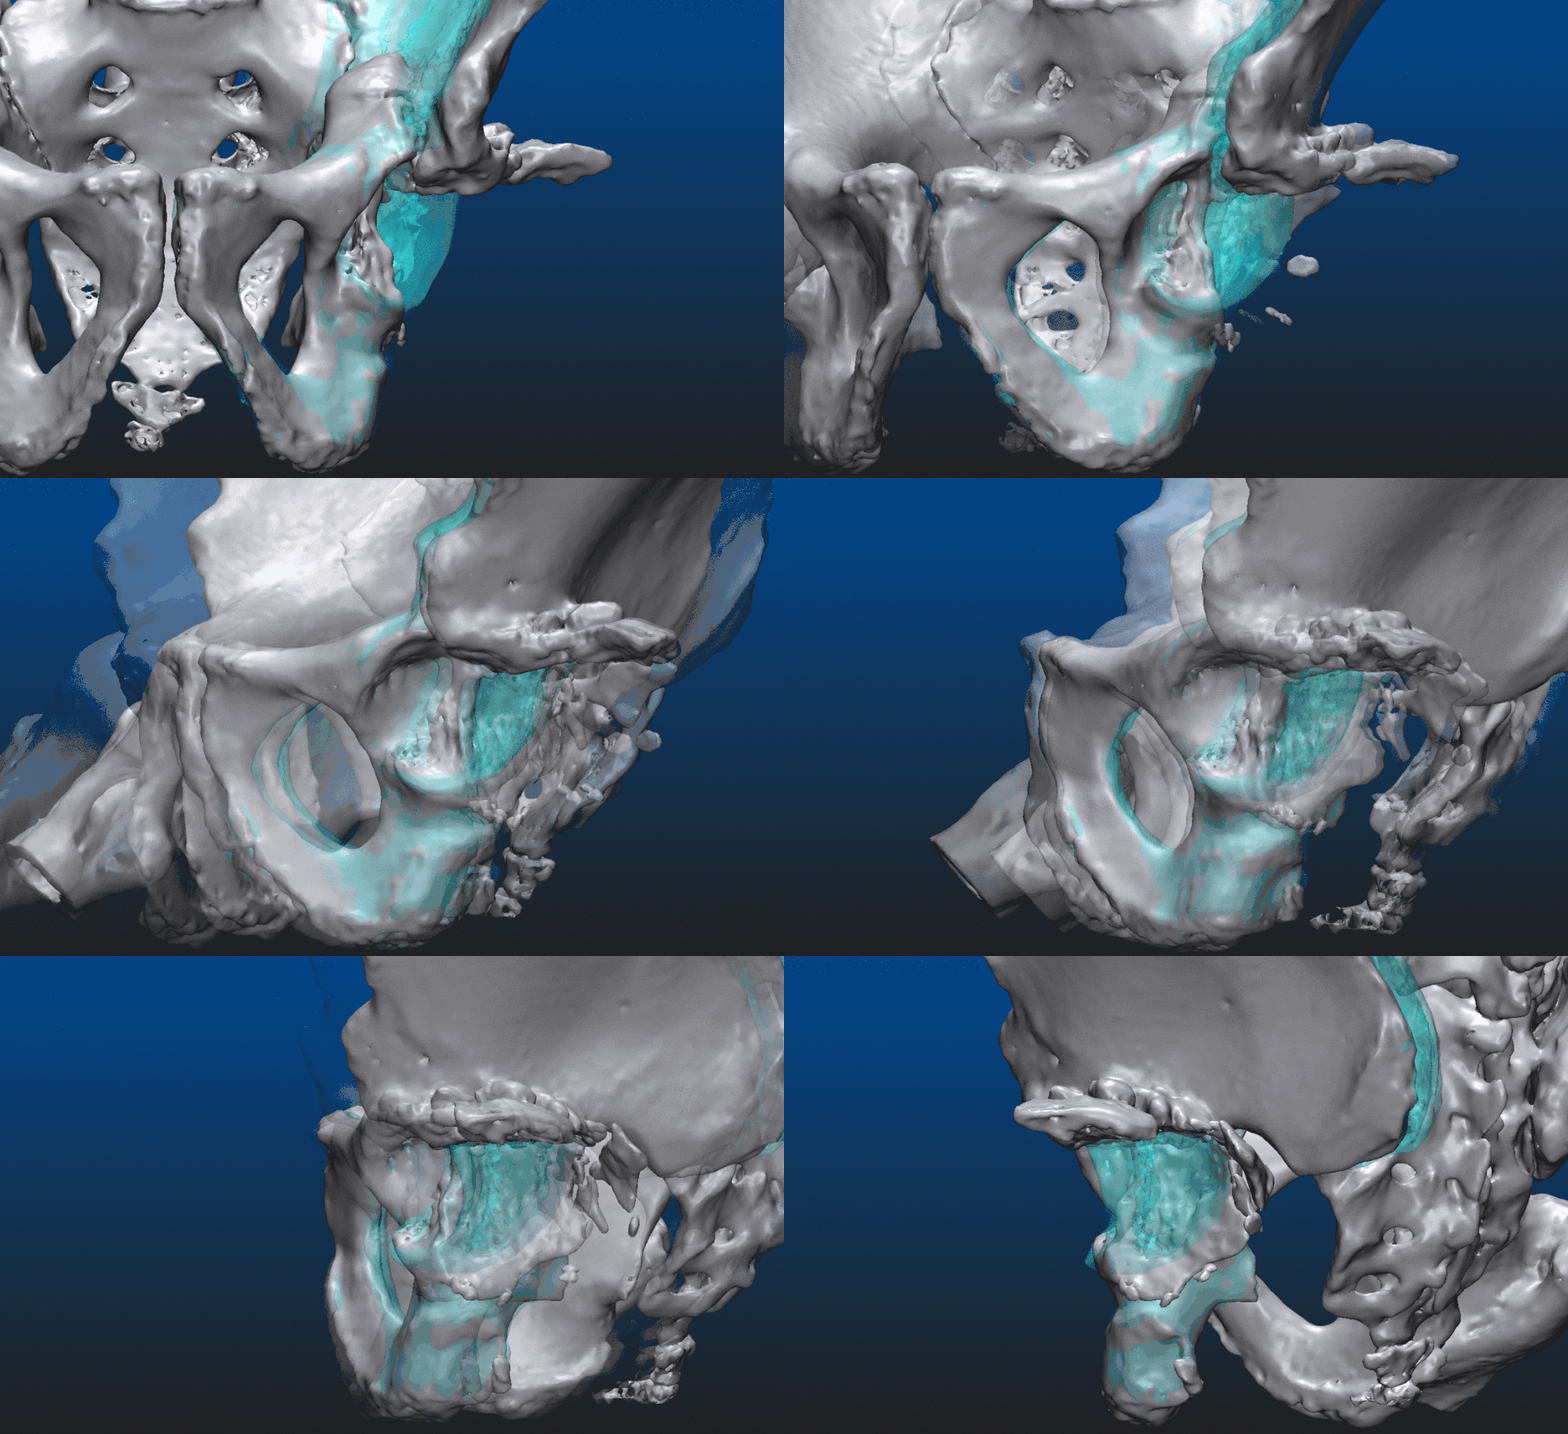
These 3-dimensional models already can assist the surgeon to a certain degree. Reasonable goals can be set, however, to take this a couple of steps further even. The aim is to visualize an approximation of what the left side of the hip should resemble after the operation, helping to determine which parts need more support and strengthening. Make sure to explore the set of geometric tools available, share partial results with the radiologist, ask for a review before presenting the results to the surgeon. Doctors usually have a limited amount of time for each case, the shorter the better. The habit of having the answers before the questions are asked can be developed over time.
A short description of the steps that could be taken, regarding this case, are given here as follows:
Separate the right femur from the larger object, similar to the left one. Again, either with a higher threshold, a different 2D-3D slice-by-slice segmentation process provided by a software solution, maybe an own implementation and/or a lot of manual mesh editing, etc.
Obtain the model of the right pelvis by detaching it along the sacroiliac joint.
Mirror the model of the right pelvis across the sagittal plane. Perform registration of the mirrored object, e.g. a point set registration, an iterative closest point approach perhaps. Easily recognizable feature points could be useful, on the pubic arch, the ischial tuberosity, and so on. Make sure to not use anatomical or feature points on bone segments that were dislocated on the left side.
Hide the left femur if necessary, set an appropriate amount of transparency where needed.
The resulting set of images are presented here from two distinct view points. If possible, an animation or video should be created, at least something similar to the one at the top of this post. (Preferably not as compressed with a fix rotation point.) This can present the surgical area and the entire state of the patient to the specialists involved, in an easily digestible form.


